By Mark Quirk
The average human lifespan has been increasing for years. Using data from the UK Office of National Statistics in 1920 life expectancy for men was 55 years and women 58, and in 2020 for men it was 79 and women 83 years[a] [1,2]. So, we’ve seen great increases over the last hundred years.
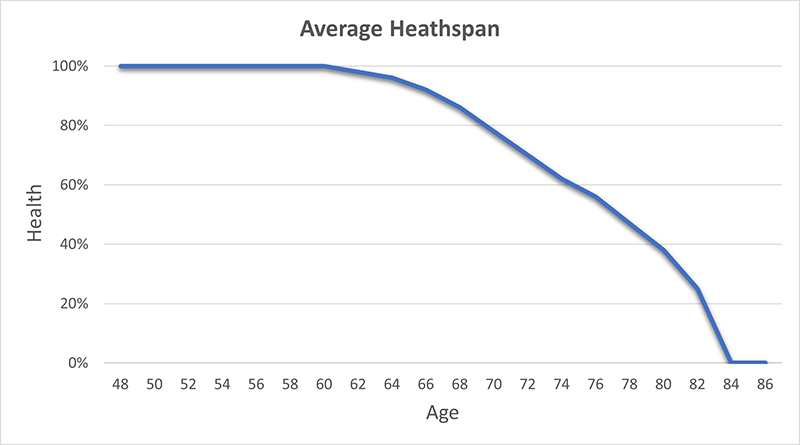
Though disability-free healthy life expectancy, what I will call healthspan is shorter than life expectancy – for men (pre-covid), it was just under 63 years and for women, just under 62 years. So, using averages, we’ll spend 15-20 years with some level of disability due to health at the end of our lives [3] – as depicted in the average healthspan graph below.

If this sounds frightening, bear in mind it doesn’t predict your lifespan or healthspan – you may be already beyond the averages or on a path to stretch beyond them. And critically, there is always something you can do to tip the odds in your favour!
So, what’s possible? If you bring to mind your impression of people in their 90’s, what do you see? Do you see disability and reduced ability, or something different? Perhaps you know someone in their nineties who is as fit as a fiddle!
If we move our attention to parts of the world known for their lifespan, such as the Blue Zones identified by National Geographic’s Dan Buettner, we see a different picture than is commonly recalled for our elderly citizens. The Blue Zones have a higher-than-average number of centenarians, that is, people aged 100 years or older, and it’s not just that they live longer; they stay healthy for longer, too, reducing the overall number of years spent being ill before they leave this mortal coil.
If you were asked to choose between lifespan and healthspan, where a longer lifespan meant an additional five years of being disabled through disease, or exchanging the extra five years for a much longer healthspan, being active and capable, which would you choose? It’s a hypothetical question, of course, but I think many of us would select healthspan over lifespan. In reality, an improved healthspan is also likely to enhance lifespan, but even if it didn’t, I would choose healthspan over lifespan.
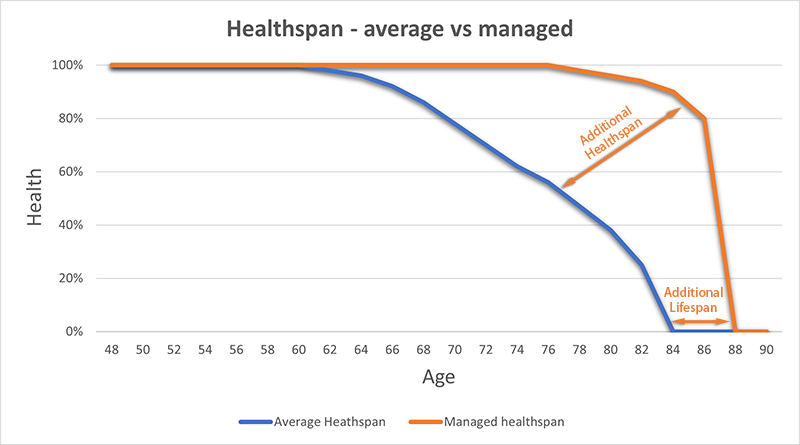
How might it look if we go back to our graph and add on improved healthspan? The ‘Healthspan – average vs managed’ chart compares the averages suggested by the Office for National Statistics data, labelled Average Healthspan, against a more idealised healthspan that I’ve called managed healthspan which uses an active prevention strategy rather than the typical reactive strategy used in national healthcare.

That managed healthspan in the orange bar isn’t based on statistics, I can’t point to specific studies to authenticate it (though evidence from the blue zones, and people that stay healthy for longer is of course relevant). But we can look at the most common reasons for the average ‘poor’ healthspan, including the diseases that lead to the average healthspan and untimely death, and use well-studied preventative strategies to improve our odds in avoiding them, which becomes our active prevention strategy.
Death, as they say, is one of two inevitable aspects of life (taxes being the other of course). Something will eventually get us, so what we’re doing is developing a personal strategy and taking action for healthspan – so we can live a healthy life for as long as possible.
[1] Office for National Statistics, National life tables – life expectancy in the UK: 2018 to 2020, (2021).
https://www.ons.gov.uk/peoplepopulationandcommunity/birthsdeathsandmarriages/lifeexpectancies/bulletins/nationallifetablesunitedkingdom/2018to2020.
[2] Office for National Statistics, Mortality in England and Wales: past and projected trends in average lifespan, (2022). https://www.ons.gov.uk/peoplepopulationandcommunity/birthsdeathsandmarriages/lifeexpectancies/articles/mortalityinenglandandwales/pastandprojectedtrendsinaveragelifespan.
[3] Office for National Statistics, Health state life expectancies, UK: 2018 to 2020, (2022). https://www.ons.gov.uk/peoplepopulationandcommunity/healthandsocialcare/healthandlifeexpectancies/bulletins/healthstatelifeexpectanciesuk/2018to2020.
[a] using Period age at death which is the most pessimistic way of looking at life expectancy, see for ONS for other ways to use the statistics.
